KS0394 EASY plug GP2Y1014AU PM2 Dust Sensor Module: Difference between revisions
Keyestudio (talk | contribs) No edit summary |
Keyestudio (talk | contribs) |
||
| (15 intermediate revisions by the same user not shown) | |||
| Line 9: | Line 9: | ||
The output is an analog voltage proportional to the measured dust concentration, with a sensitivity of 0.5V/0.1mg/m3.<br> | The output is an analog voltage proportional to the measured dust concentration, with a sensitivity of 0.5V/0.1mg/m3.<br> | ||
The sensor's four pins are led out as Registered Jack, allowing you to connect it to EASY plug Control board V2.0 for communication with only an RJ11 cable. <br> | The sensor's four pins are led out as Registered Jack, allowing you to connect it to EASY plug Control board V2.0 for communication with only an RJ11 cable. <br> | ||
<span style=color:red> '''Special Note:''' <br> | |||
The sensor/module is equipped with the RJ11 6P6C interface, compatible with our keyestudio EASY plug Control Board with RJ11 6P6C interface. <br> If you have the control board of other brands, it is also equipped with the RJ11 6P6C interface but has different internal line sequence, can’t be used compatibly with our sensor/module. </span><br> | |||
<br> | <br> | ||
==Technical Details== | ==Technical Details== | ||
*Power supply voltage: 5-7V | *Power supply voltage: 5-7V | ||
| Line 26: | Line 30: | ||
<br> | <br> | ||
==How to Test it?== | ==How to Test it?== | ||
===Example 1 Test Dust Density=== | |||
<br> | |||
'''Connect It Up:''' <br> | '''Connect It Up:''' <br> | ||
<br>[[File:0394图片2.png|600px|frameless|thumb]]<br> | <br>[[File:0394图片2.png|600px|frameless|thumb]]<br> | ||
<br> | |||
'''Upload the Code 1:''' <br> | '''Upload the Code 1:''' <br> | ||
Copy and paste below code to Arduino IDE and upload. <br> | Copy and paste below code to [https://wiki.keyestudio.com/How_to_Download_Arduino_IDE Arduino IDE] and upload. <br> | ||
< | <span style="color: red">'''Note: ''' Before compile the code, do remember to put the libraries needed inside the libraries folder of Arduino IDE directory. Or else, it will fail to verify. <br> | ||
You can download all the libraries from the link below: <br> | You can download all the libraries from the link below: <br> | ||
https://drive.google.com/open?id=1TSsLYrbKRtC4f2hWYcTz2H2OvVCpPhpq | https://drive.google.com/open?id=1TSsLYrbKRtC4f2hWYcTz2H2OvVCpPhpq | ||
| Line 85: | Line 93: | ||
<br> | <br> | ||
Example Result: <br> | '''Example Result:''' <br> | ||
Done uploading the code, you should be able to see the measured dust density is showed on the LCD screen. | Done uploading the code, you should be able to see the measured dust density is showed on the LCD screen. | ||
<br>[[File:0394图片3.png|600px|frameless|thumb]]<br> | <br>[[File:0394图片3.png|600px|frameless|thumb]]<br> | ||
<br> | <br> | ||
<br> | |||
===Example 2 Air Quality=== | |||
<br> | |||
'''Connect It Up:''' <br> | '''Connect It Up:''' <br> | ||
<br>[[File:0394图片4.png| | <br>[[File:0394图片4.png|500px|frameless|thumb]]<br> | ||
<br> | |||
'''Upload the Code 2:''' | '''Upload the Code 2:''' | ||
<pre> | <pre> | ||
| Line 122: | Line 134: | ||
} | } | ||
</pre> | </pre> | ||
<br> | <br> | ||
Example Result: <br> | '''Example Result:''' <br> | ||
Done upload the code, open the Arduino IDE’s serial monitor, and set the baud rate to 9600, you should be able to see the data. | Done upload the code, open the Arduino IDE’s serial monitor, and set the baud rate to 9600, you should be able to see the data. | ||
<br>[[File:0394图片5.png|600px|frameless|thumb]]<br> | <br>[[File:0394图片5.png|600px|frameless|thumb]]<br> | ||
| Line 137: | Line 150: | ||
<br> | <br> | ||
==Resources Download== | ==Resources Download== | ||
https://fs.keyestudio.com/KS0394 | |||
https:// | |||
<br> | <br> | ||
==Get One Now== | ==Get One Now== | ||
*'''Official website | *[https://www.keyestudio.com/keyestudio-rj11-easy-plug-gp2y1014au-pm25-dust-sensor-module-for-arduino-air-detection-p0506-p0506.html '''Official website''' ] | ||
*[https://www.aliexpress.com/store/product/Keyestudio-RJ11-EASY-plug-GP2Y1014AU-PM2-5-Dust-Sensor-Module-for-Arduino-Air-Detection/1452162_32967134878.html?spm=2114.12010611.8148356.25.27956c0ehzaxb3 Shop on aliexpress ] | |||
<br> | <br> | ||
[[category: EASY Plug]] | [[category: EASY Plug]] | ||
Latest revision as of 08:54, 8 January 2021
Description
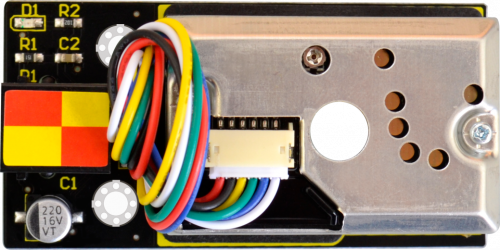
EASY plug GP2Y1014AU PM2.5 Dust sensor is particularly effective in detecting very fine particles, such as cigarette smoke, and is commonly used in air purifier system.
In the device, an infrared light emitting diode and a phototransistor are diagonally arranged to allow it to detect the light reflected by dust in the air.
The sensor has very low current consumption (up to 20mA, typical of 11 mA) and can carry up to 7VDC sensors.
The output is an analog voltage proportional to the measured dust concentration, with a sensitivity of 0.5V/0.1mg/m3.
The sensor's four pins are led out as Registered Jack, allowing you to connect it to EASY plug Control board V2.0 for communication with only an RJ11 cable.
Special Note:
The sensor/module is equipped with the RJ11 6P6C interface, compatible with our keyestudio EASY plug Control Board with RJ11 6P6C interface.
If you have the control board of other brands, it is also equipped with the RJ11 6P6C interface but has different internal line sequence, can’t be used compatibly with our sensor/module.
Technical Details
- Power supply voltage: 5-7V
- Working temperature: -10 to +65 degrees Celsius
- Current consumption: 20mA maximum
- Minimum particle detection: 0.8 microns
- Sensitivity: 0.5V/(0.1mg/m3)
- Voltage in clean air: 0.9V (typical)
- Working temperature: -10°C to 65°C
- Storage temperature: -20°C to 80°C
- Service life: 5 years
- Dimensions: 35.6mm × 69.7mm × 28mm
- Weight: 27g
How to Test it?
Example 1 Test Dust Density
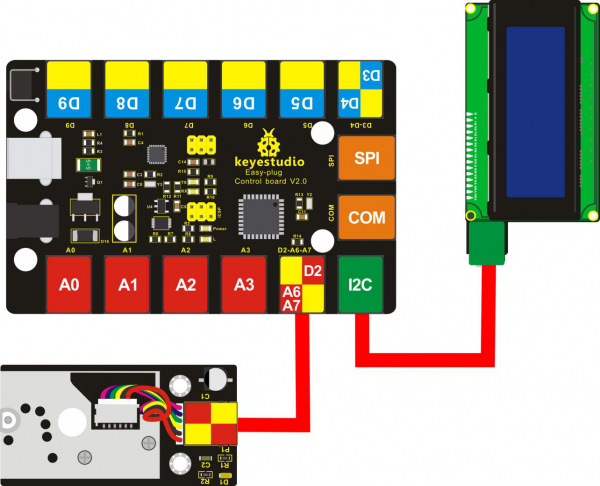
Upload the Code 1:
Copy and paste below code to Arduino IDE and upload.
Note: Before compile the code, do remember to put the libraries needed inside the libraries folder of Arduino IDE directory. Or else, it will fail to verify.
You can download all the libraries from the link below:
https://drive.google.com/open?id=1TSsLYrbKRtC4f2hWYcTz2H2OvVCpPhpq
#include <Wire.h>
#include <LiquidCrystal_I2C.h>
LiquidCrystal_I2C lcd(0x27,20,4);  // set the LCD address to 0x27 for a 16 chars and 2 line display
int measurePin = 6; //Connect dust sensor to Arduino A6 pin
int ledPower = 2;   //Connect 3 led driver pins of dust sensor to Arduino D2
int samplingTime = 280;
int deltaTime = 40;
int sleepTime = 9680;
float voMeasured = 0;
float calcVoltage = 0;
float dustDensity = 0;
void setup(){
  lcd.init();                      // initialize the lcd
  lcd.init();
  // Print a message to the LCD.
  lcd.backlight();
  lcd.setCursor(0,0);
  lcd.print("Raw Signal Value: ");
  lcd.setCursor(0,2);
  lcd.print("Voltage:");
  lcd.setCursor(0,3);
  lcd.print("Dust Density:");
  pinMode(ledPower,OUTPUT);
}
void loop(){
  digitalWrite(ledPower,LOW); // power on the LED
  delayMicroseconds(samplingTime);
  voMeasured = analogRead(measurePin); // read the dust value
  delayMicroseconds(deltaTime);
  digitalWrite(ledPower,HIGH); // turn the LED off
  delayMicroseconds(sleepTime);
  // 0 - 5V mapped to 0 - 1023 integer values
  // recover voltage
  calcVoltage = voMeasured * (5.0 / 1024.0);
  // linear eqaution taken from http://www.howmuchsnow.com/arduino/airquality/
  // Chris Nafis (c) 2012
  dustDensity = 0.17 * calcVoltage - 0.1;
  lcd.setCursor(1,1);
  lcd.print(voMeasured);
  lcd.setCursor(9,2);
  lcd.print(calcVoltage);
  lcd.setCursor(14,3);
  lcd.print(dustDensity);
  delay(1000);
}
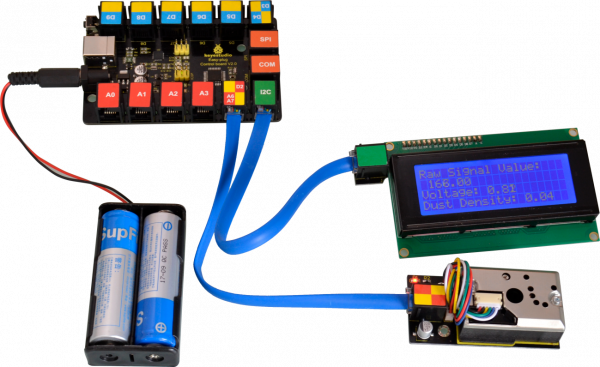
Example Result:
Done uploading the code, you should be able to see the measured dust density is showed on the LCD screen.
Example 2 Air Quality
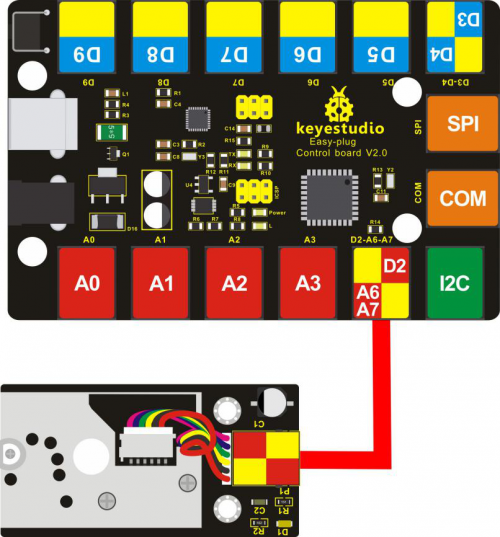
Upload the Code 2:
int dustPin=6;
float dustVal=0;
int ledPower=2;
int delayTime=280;
int delayTime2=40;
float offTime=9680;

void setup(){
Serial.begin(9600);
pinMode(ledPower,OUTPUT);
pinMode(dustPin, INPUT);
}

void loop(){
// ledPower is any digital pin on the arduino connected to Pin 2 on the sensor
digitalWrite(ledPower,LOW);
delayMicroseconds(delayTime);
dustVal=analogRead(dustPin);
delayMicroseconds(delayTime2);
digitalWrite(ledPower,HIGH);
delayMicroseconds(offTime);
delay(1000);
if (dustVal>36.455)
Serial.println((float(dustVal/1024)-0.0356)*120000*0.035);
}
Example Result:
Done upload the code, open the Arduino IDE’s serial monitor, and set the baud rate to 9600, you should be able to see the data.
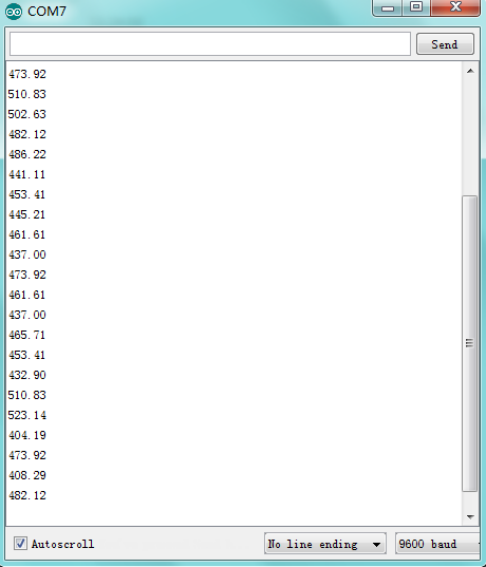
Compare the measured data to the air quality:
- 3000+ = very poor
- 1050-3000 = poor
- 300-1050 = general
- 150-300 = good
- 75-150 = very good
- 0-75 = excellent
Resources Download
https://fs.keyestudio.com/KS0394
Get One Now
