Ks0196 keyestudio PM2.5 Dust Sensor Module: Difference between revisions
Keyestudio (talk | contribs) |
Keyestudio (talk | contribs) |
||
| (6 intermediate revisions by the same user not shown) | |||
| Line 61: | Line 61: | ||
The V0 pin — which is an Analog pin — must be connected with the Arduino analog pin to A0. | The V0 pin — which is an Analog pin — must be connected with the Arduino analog pin to A0. | ||
'''Project code:''' | |||
<pre> | <pre> | ||
| Line 102: | Line 102: | ||
'''Project results:''' | |||
Upload the code to the development board, after success, open the serial port monitoring of ARDUINO, you can see the following data: | Upload the code to the development board, after success, open the serial port monitoring of ARDUINO, you can see the following data: | ||
| Line 119: | Line 119: | ||
* In our project just now, the measured value shows that the air quality is Very Good. | * In our project just now, the measured value shows that the air quality is Very Good. | ||
'''(2)Project 2: Print the value on screen''' | |||
* Project hardware: | * Project hardware: | ||
| Line 130: | Line 129: | ||
* cable*1 | * cable*1 | ||
'''Connection Diagram:''' | |||
<br>[[File:图片2- ks0196.png|600px|frameless|thumb]]<br> | <br>[[File:图片2- ks0196.png|600px|frameless|thumb]]<br> | ||
| Line 188: | Line 187: | ||
'''Project results:''' | |||
Upload the code to the development board, after success, 2004 LED will display the following data: | Upload the code to the development board, after success, 2004 LED will display the following data: | ||
| Line 203: | Line 202: | ||
* 0-75 = Tiptop | * 0-75 = Tiptop | ||
* In this project , the 2004 LCD value shows that the air quality is Very Good. | * In this project , the 2004 LCD value shows that the air quality is Very Good. | ||
== Resource: == | |||
https://fs.keyestudio.com/KS0196 | |||
Latest revision as of 16:48, 8 January 2021
Introduction
Due to increasing air pollution and the associated health problems, measuring air quality is becoming more and more necessary in big cities. There are many sensors available on the market that allow you to do measure air quality and recently.
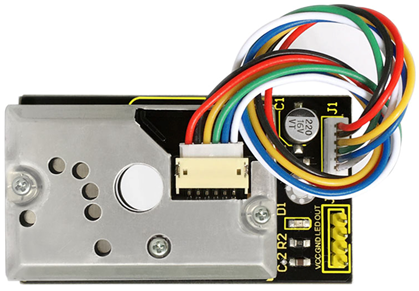
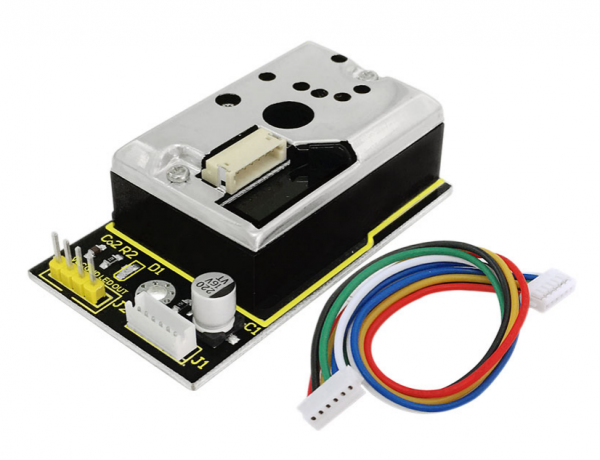
This is sharp's GP2Y1010AU0F optical dust sensor. This dust sensor is small in size and can detect dust and smoke particles in the environment. It consumes very little power while it’s running, making it ideal for an always-on monitoring system.
This tutorial focuses on how to connect the Sharp optical dust sensor to an Arduino. The reading of the sensor will then be displayed on a LED screen.
GP2Y1010AU0F Optical Dust Sensor
The sensor has a tiny six-pin connection interface, it comes with a connector when you usually buy it. The sensor generates an analog output signal on pin5- Vo, it does not require any external components for operation and requires only a 3.3V supply, making it easy to interface with the Arduino board. Some example applications of this sensor include:
- Air purifier
- Air conditioner
- Air monitor
- PM2.5 detector
Specification Parameters:
- Power Voltage: 5V
- Operating Temperature: -10℃ to 65℃
- Operating Current: 20mA (max)
- Detecting Value of Minimum Particle: 0.8μm
- Sensitivity: 0.5V/(0.1mg/m3)
- Voltage of Cleaning Air: 0.9V(typical)
- Storage Temperature: -20℃~80℃
- Life time: 5 years
- Dimension: 62mm×36mm×20mm
Why Chose the GP2Y1010AU0F?
- It uses the latest technology for sensing, including an infrared LED, a set of lenses, a photodiode detector, and an electromagnetic shield.
- It has a high sensitivity to dust conditions, followed by a fast response time between the sensor and the microcontroller.
- Due to the three wires (VCC, GND, and signal) leading to the microcontroller, this sensor can be prepared using a simple hardware framework, making it easy for beginners to interface with the Arduino.
- The sensor’s small size allows for easy installation in an air quality monitoring box or any other small DIY project case.
How Does the Dust Sensor Work?
The dust sensor uses an optical sensing method to detect dust. A photosensor and an infrared light-emitting diode which is known as an IR LED are optically arranged in the dust sensor module. The photo-sensor (PT) detects the reflected IR LED rays which are bounced off of the dust particles in the air.
The GP2Y1010AU0F module can sense the tiniest particles in the air, which lets it detect even cigarette smoke. A high output pulse from the sensor is triggered whenever it detects dust.
How to Use Dust Sensor:
(1)Project 1 (get the value of the sensor)
- Project hardware:
- Arduino development board*1
- Dust Sensor*1
- 4pin male to female cable*1USB
- cable*1
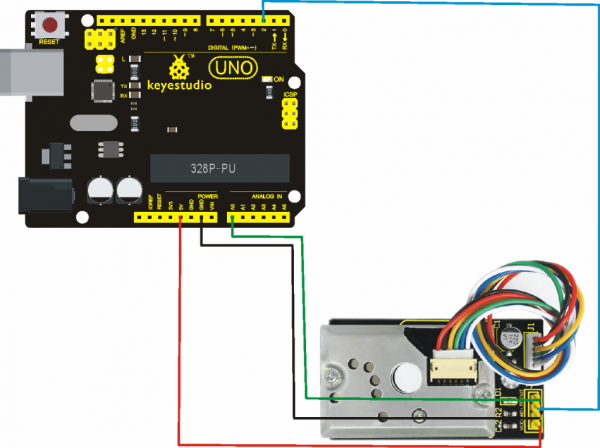
Connection Diagram:
The LED pin of the sensor should be connected with Arduino’s digital pin2, which is known as the output pin of the dust sensor module. The V0 pin — which is an Analog pin — must be connected with the Arduino analog pin to A0.
Project code:
/*
 Dust Sensor project for arduino
 sensor GP2Y1010AU0F
 www.keyestudio.com
*/

int measurePin = 0; //Connect dust sensor to Arduino A0 pin
int ledPower = 2;   //Connect led driver pins of dust sensor to Arduino D2
int samplingTime = 280;
int deltaTime = 40;
int sleepTime = 9680;
float voMeasured = 0;
float calcVoltage = 0;
float dustDensity = 0;
void setup(){
  Serial.begin(9600);
  pinMode(ledPower,OUTPUT);
  Serial.print("****************** keyestudio ******************\n");
}
void loop(){
  digitalWrite(ledPower,LOW); // power on the LED
  delayMicroseconds(samplingTime);
  voMeasured = analogRead(measurePin); // read the dust value
  delayMicroseconds(deltaTime);
  digitalWrite(ledPower,HIGH); // turn the LED off
  delayMicroseconds(sleepTime);
  // 0 - 5V mapped to 0 - 1023 integer values
  // recover voltage
  calcVoltage = voMeasured * (5.0 / 1024.0);
  dustDensity = 170 * calcVoltage - 0.1;
  Serial.print("The dust concentration is: ");
  Serial.print(dustDensity);
  Serial.print(" ug/m3\n");
  delay(1000);
}//******************************************************************
Project results:
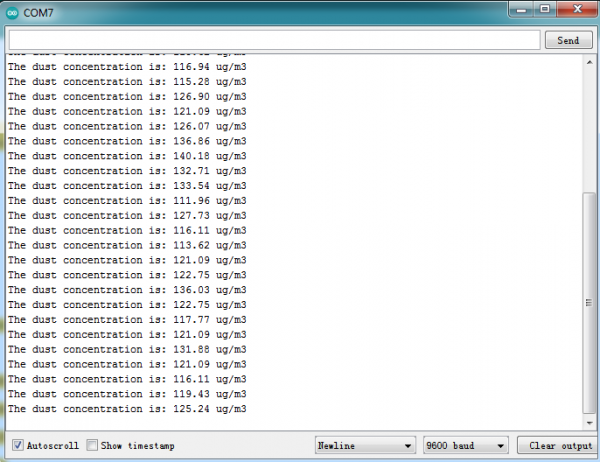
Upload the code to the development board, after success, open the serial port monitoring of ARDUINO, you can see the following data:
- Data compared to air quality:
- 3000 + = Very Bad
- 1050-3000 = Bad
- 300-1050 = Ordinary
- 150-300 = Good
- 75-150 = Very Good
- 0-75 = Tiptop
- Here is a chart of dust concentration comparison,
- Can you check which level the dust concentration value is?
- In our project just now, the measured value shows that the air quality is Very Good.
(2)Project 2: Print the value on screen
- Project hardware:
- Arduino development board*1
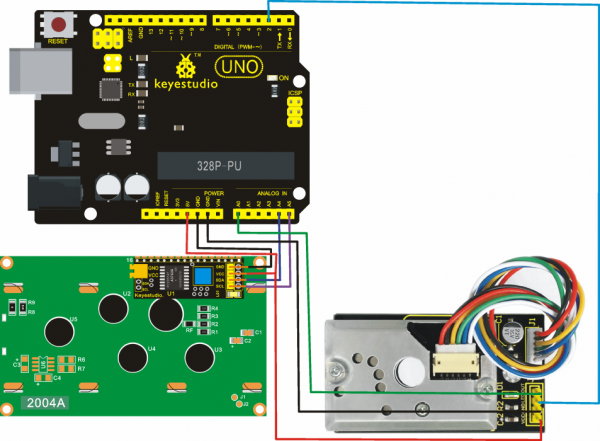
- Keyestudio i2c 2004 Lcd (Need to be purchased separately)
- Dust Sensor*1
- 4pin male to female cable*2
- USB
- cable*1
Connection Diagram:
Project code: Click here to download the 2004 LCD libraries;
/*
Dust Sensor project for arduino
sensor GP2Y1010AU0F
Lcd 2004 display
www.keyestudio.com
- /
- include <Wire.h>
- include <LiquidCrystal_I2C.h>
LiquidCrystal_I2C lcd(0x27,20,4); // set the LCD address to 0x27 for a 16 chars and 2 line display int measurePin = 0; //Connect dust sensor to Arduino A0 pin int ledPower = 2; //Connect 3 led driver pins of dust sensor to Arduino D2 int samplingTime = 280; int deltaTime = 40; int sleepTime = 9680; float voMeasured = 0; float calcVoltage = 0; float dustDensity = 0; void setup(){
 lcd.init();                      // initialize the lcd
 lcd.init();
 // Print a message to the LCD.
 lcd.backlight();
 lcd.setCursor(0,0);
 lcd.print("Raw Signal Value: ");
 lcd.setCursor(0,2);
 lcd.print("Voltage:");
 lcd.setCursor(0,3);
 lcd.print("Dust Density:");
 pinMode(ledPower,OUTPUT);
} void loop(){
 digitalWrite(ledPower,LOW); // power on the LED
 delayMicroseconds(samplingTime);
 voMeasured = analogRead(measurePin); // read the dust value
 delayMicroseconds(deltaTime);
 digitalWrite(ledPower,HIGH); // turn the LED off
 delayMicroseconds(sleepTime);
 // 0 - 5V mapped to 0 - 1023 integer values
 // recover voltage
 calcVoltage = voMeasured * (5.0 / 1024.0);
 dustDensity = 0.17 * calcVoltage - 0.1;
 lcd.setCursor(1,1);
 lcd.print(voMeasured);
 lcd.setCursor(9,2);
 lcd.print(calcVoltage);
 lcd.setCursor(14,3);
 lcd.print(dustDensity);
 delay(1000);
}//************************************************************
Project results:
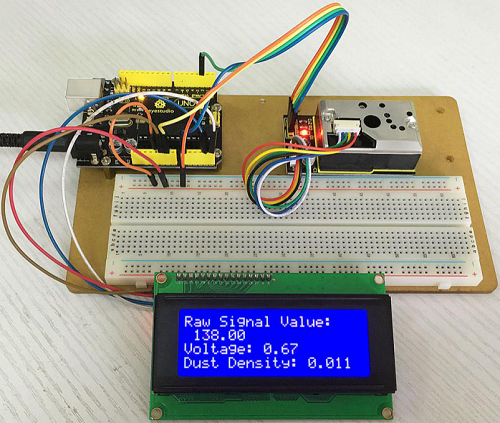
Upload the code to the development board, after success, 2004 LED will display the following data:
Data compared to air quality:
- 3000 + = Very Bad
- 1050-3000 = Bad
- 300-1050 = Ordinary
- 150-300 = Good
- 75-150 = Very Good
- 0-75 = Tiptop
- In this project , the 2004 LCD value shows that the air quality is Very Good.
