Ks0015 keyestudio Pulse Rate Monitor
Introduction
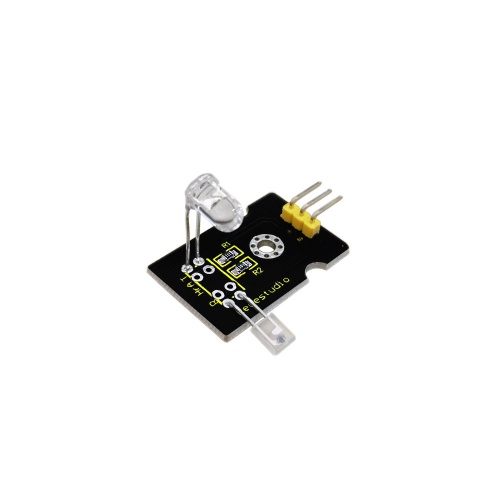
This module uses a ultra-bright infrared LED and a phototransistor to detect the pulse of your finger. The red LED then flashes in time with your pulse.
Working Principle: Shine the bright LED onto one side of your finger while the
phototransistor on the other side of your finger picks up the amount of transmitted light. The resistance of the phototransistor will vary slightly as the blood pulses through your finger.

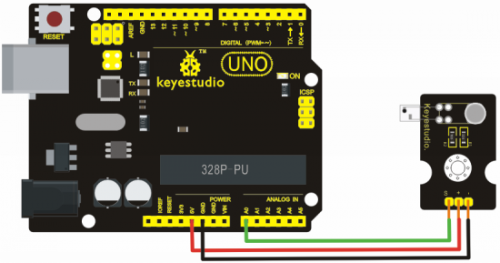
Connection Diagram
Sample Code
The program for this project is quite tricky to get right. Indeed, the first step is not to run the entire final script, but rather a test script that will gather data that we can then paste into a spreadsheet and chart to test out the smoothing algorithm (more on this later). The test script is provided in Listing Project 12.
int ledPin = 13;
int sensorPin = 0;
double alpha = 0.75;
int period = 20;
double change = 0.0;
void setup()
{
pinMode(ledPin, OUTPUT);
Serial.begin(115200);
}
void loop()
{
static double oldValue = 0;
static double oldChange = 0;
int rawValue =
analogRead(sensorPin);
double value = alpha * oldValue
+ (1 - alpha) * rawValue;
Serial.print(rawValue);
Serial.print(“,”);
Serial.println(value);
oldValue = value;

delay(period);
}
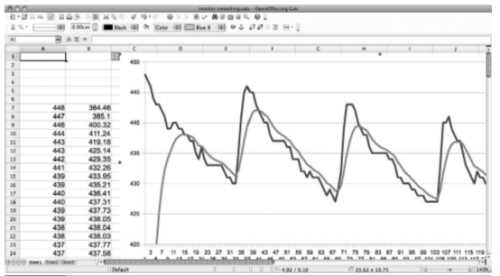
This script reads the raw signal from the analog input and applies the smoothing function and then writes both values to the Serial Monitor, where we can capture them and paste them into a spreadsheet for analysis. Note that the Serial Monitor’s communications is set to its fastest rate to minimize the effects of the delays caused by sending the data. When you start the Serial Monitor, you will need to change the serial speed to 115200 baud. Copy and paste the captured text into a spreadsheet. The resultant data and a line chart drawn from the two columns are shown in Figure 5-17. The more jagged trace is from the raw data read from the analog port, and the smoother trace clearly has most of the noise removed. If the smoothed trace shows significant noise—in particular, any false peaks that will confuse the monitor—increase the level of smoothing by decreasing the value of alpha. Once you have found the right value of alpha for your sensor arrangement, you can transfer this value into the real sketch and switch over to using the real sketch rather than the test sketch. The real sketch is provided in the following listing on the next page.
int ledPin = 13;
int sensorPin = 0;
double alpha = 0.75;
int period = 20;
double change = 0.0;
void setup()
{
pinMode(ledPin, OUTPUT);
Serial.begin(115200);
}
void loop()
{
static double oldValue = 0;
static double oldChange = 0;
int rawValue =
analogRead(sensorPin);
double value = alpha * oldValue
+ (1 - alpha) * rawValue;
Serial.print(rawValue);
Serial.print(“,”);
Serial.println(value);
oldValue = value;
delay(period);
}
LISTING PROJECT 12—TEST SCRIPT There now just remains the problem of detecting the peaks. Looking at Figure 5-17, we can see that if we keep track of the previous reading, we can see that the readings are gradually increasing until the change in reading flips over and becomes negative. So, if we lit the LED whenever the old change was positive but the new change was negative, we would get a brief pulse from the LED at the peak of each pulse. Putting It All Together Both the test and real sketch for Project 12 are in your Arduino Sketchbook. For instructions on downloading it to the board, see Chapter 1. As mentioned, getting this project to work is a little tricky. You will probably find that you have to get your finger in just the right place to start getting a pulse. If you are having trouble, run the test script as described previously to check that your detector is getting a pulse and the smoothing factor alpha is low enough.
Resources
Video
http://www.keyestudio.com/wp/2016/05/ks0015-keyestudio-pulse-rate-monitor/
https://drive.google.com/open?id=1hj_lQm3yU5dgQn5EQ6D8L8MC1t8IMGDc
Get One Now
Official Website
http://www.keyestudio.com/keyestudio-pulse-rate-monitor-sensor-module.html

